
Technical Analysis
Technical analysis involves making use of statistics to evaluate the activity of the cryptocurrency market. It makes use of several indicators that includes price charts to identify patterns which investors use as a foundation for making trading decisions. Technical analysis is basically the use of chart lines, patterns, oscillators and statistical indicators. Chart lines are used to find points where the prices are likely to react, patterns are used to forecast where the prices are headed to while indicators and oscillators are used to ascertain trading signals.
Technical analysis is very important in cryptocurrency trading as it is through this method that traders evaluate the cryptocurrency market. Using technical analysis, cryptocurrency traders try to understand the market while isolating significant trends. There are a number of analysis tools you need to understand if you want to be successful in trading cryptocurrency, trendlines and channels are a part of these tools. You need to learn how to draw them, understand them and use them to study price action on the charts. Technical analysis is based on a number of things which are outlined below.
- Pricing of the cryptocurrency market
- The past, current and future demand of the cryptocurrency
- The factors that influence the price of a cryptocurrency
- Price movement trends
- History of the cryptocurrency
Trendlines
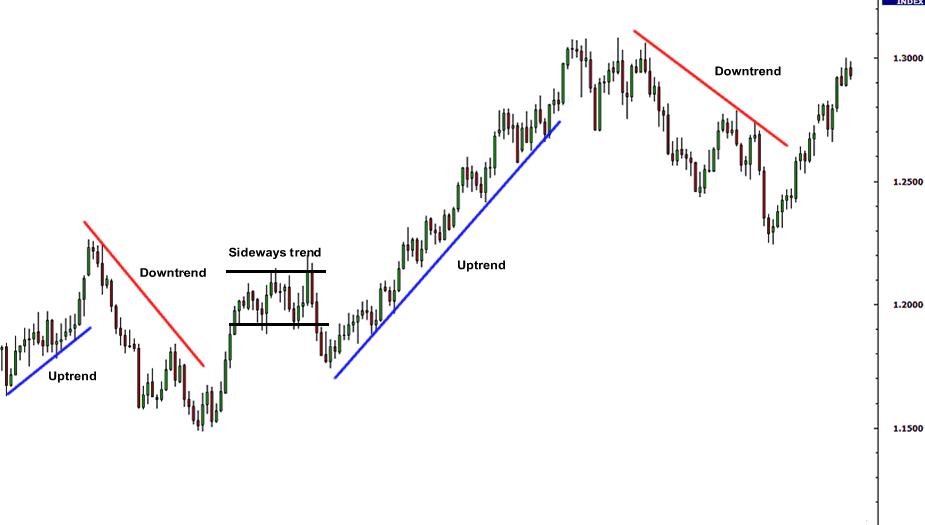
If you are new to trading cryptocurrency, you might be asking yourself “What exactly is a trend line?” A trendline basically shows the direction of the cryptocurrency price that is dominant, it is a line sketched over pivot high points or under pivot low points. Trendlines represent support and resistant levels in any timeframe, it helps traders find out the trend the market is leaning towards whether it is in a downtrend, sideways trend or uptrend. Uptrend lines links support levels while downtrend lines links resistance levels.
Trendlines perform a number of functions from showing the speed and direction of the price to explaining the patterns in price contraction periods. Trendlines inform you whether the trend is still intact. When the lines indicate a positive slope (support), it shows that the net demand is increasing while lines that indicate negative slope (resistance) shows an increase in net supply. We have a Bullish Trend when the price action is above the line with a positive slope (support) and a Bearish Trend when the price action stays under the line with a negative slope (resistance)
 Credits: ForexVps
A trend reversal is indicated when the price breaks out of the trendline, it is times like this that traders leave the trade in search of other new trades in another direction. Trendline becomes stronger when there are more points that are connected.
Types of Trendlines
- Rising Trendline / Uptrend Line
When the low points of the price are connected, a rising trendline or uptrend line is formed. You can also form this trendline by making use of closing prices, it all depends on your preference. A bullish trend remains if the price has the tendency to bounce off the uptrend line. - Falling Trendline/ Downtrend Line
This line is formed when the high points in price or high closing prices are connected. As earlier mentioned, you can decide which prices you will take reference of. A falling trend is to a cretain extent similar to a horizontal resistance level, it is, however, more dynamic.
How to Draw Trendlines
Trendlines are relatively easy to draw, what you have to do is connect two main high points or low points. Timeframes are important when creating trendlines, most analysts make use of different timeframes from 5 minutes to 4 hours. Other analysts forfeit timeframes, they rather view the trends on tick intervals. Regardless of whether you make use of timeframe or interval, the trend lines are still generally used to identify the trends. Well, that’s it in a nutshell. I have however decided to take it a step further and show steps on how to draw trendlines using Tradingview.com which has a good drawing tool that can be used to identify trend lines on a chart as well as illustrate trends.
- Enter the Address “Tradingview.com”
- Type OMGBTC or any other cryptocurrency pairs of your choice in the Ticker box
- Put the chart time frame to your preference
- You can change the chart layout by clicking on properties and click on the theme you prefer
- A chart will be displayed
- Select the trend line tool which can be found on the right-hand side of the screen.
- Draw the line from high point to high point and low point to low point
- There will be two lines showing uptrend and downtrend
Channels
Trading Price Channels or Channels as it is normally called are as important as trendlines to a cryptocurrency trader. Channels are fundamentally two similar trend lines that parallel to each other. You can make a channel by drawing a parallel line to the trendline and placing it in a position that is in line with the uptrend or the downtrend. Channels can be considered as trendline extensions.
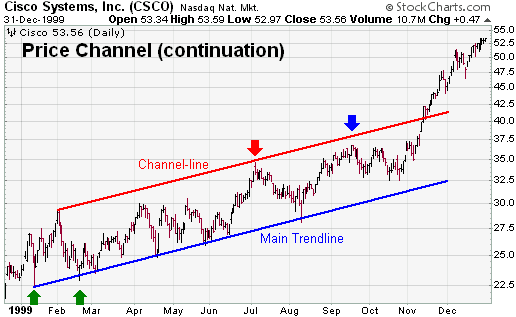
Channels basically follow the same concept as trendlines as a bullish correction is indicated by a break from a falling price channel (down channel) and a bearish correction is indicated by a break from the rising price channel (up channel). You can make use of the equidistant tool on the program to automatically draw the channel lines on the chart once you’ve drawn the trendlines. Channel lines can be viewed as price fluctuation boundaries. They are used to indicate areas to fix profit and loss.
Types of Trading Price Channels
- Rising Price Channel / Up Channel
A rising price channel is formed when a parallel line is drawn to the trendline and it is placed in the uptrend line position. A breakout in a rising channel can be indicated if there is a subsequent high that fails to touch the opposite trendline on the chart. This breakout indicates that the price trend is likely to change. - Falling Price Channel/ Down Channel
A falling price channel is formed when a parallel line is drawn to the trendline and it is placed in the same position with the downtrend line. You can trade a falling price channel by looking for the subsequent low that doesn’t touch the lower trend line on the chart. Once you view this, this signifies that a reverse action is about to take place on the price.
Fundamental Purposes of Channel to Traders
- For the present trend, the channel shows the support and resistance levels as well as gives an indication for potential entry and exit prices.
- The state of the cryptocurrency market can be known using channels. It allows traders make calculated decisions based on the state of the market.
Best Time to Enter and Exit the Cryptocurrency Market
The best time to enter into the cryptocurrency market is when the prices come in contact with the lower trendline. You might also be wondering when profit will start coming in, the answer to this question is relative. But a good time for profiting is when the prices come in contact with the upper trendline. it is also important to keep in mind that trading cryptocurrency when the price comes in contact with either the support or resistance level, is not a foolproof idea as these levels are not always constant and they might have a tendency to break.
You should also need to remember your stop losses as they help to reduce losses in the case of the level breaking. If you trade at the resistance level and it breaks, profit will be lost and if you buy cryptocurrency at the support level and it breaks, the price will plummet and you would lose your funds. The only indication that either of these levels has broken is the “bounce”. This option is the safest way to avoid losses although it means that you would not get either the lowest entry price or the highest exit price.
Tips to Take Note of as A Cryptocurrency Trader
There are a number of things you have to take note of before you start making use of trend lines and they are as follows.
- The Price of A Coin Might Be Different In Individual Exchanges
It is important to note that there isn’t any general price for any cryptocurrency as the prices might differ depending on the cryptocurrency exchange you are using due to arbitrage. - Understand Trading Pairs
A trading pair is basically the relationship two assets have for trading coins. Trading pairs can exist between fiat currency and cryptocurrency or two different cryptocurrencies. It is important that you stay informed about the prices of the currencies in a trading pair as that will help in your trading decision making. - Do Not Chase Something in an Uptrend
It is important that you do not chase anything in an uptrend as you can get trapped in a retracement. You should take note specifically if the moves are more than 100%. - Do not Buy into Anything that Is falling
You should wait for the downtrend to break completely before you buy into anything as there is probability of the coin overturning. Ripple is a perfect example of this. - Make Your Entry into the Market Using Strong Coins or Tokens
Strong coins with a relatively good ecosystem and tokens with utility that is good are the best way to make entry into trading. These coins will be in a relatively small boring zone but it is best that you use this coins to enter. Patience is also a virtue when making use of these coins or tokens. - Include Stable Coins into your Portfolio
Coins like Bitcoin and Ethereum are relatively stable coins and it doesn’t hurt to have them in your portfolio. - Ensure that you are redrawing the trendlines constantly
This will help to prevent errors when you are trying to understand the charts, redrawing it multiple times is the best option.
Conclusion
Traders who understand trendlines and channels tend to do quite well in the cryptocurrency market which is why it is very important that you get yourselves acquainted with the intricacies of these analytic tools in order to maximise your profit / avoid losses. This does not mean that these tools will guarantee that you would make profit and no losses, it just means that your accuracy and consistency during your trade will be improved. These analytic tools provide indications of the potential best time to trade as well as a safety net in case of losses. It is important to remember that there are always risks involved when trading cryptocurrencies, please do not invest more than you can afford to lose.
The Cryptotrading 101 Series
- Cryptotrading 101: Types of Market Analysis
- Cryptotrading 101 : Types Of Chart & How To Read Them
- Cryptotrading 101 : Types of Trading Styles
- Cryptotrading 101 : Support and Resistance
- Cryptotrading 101 : Trendlines & Channels
- Cryptotrading 101: Candlesticks Pattern ( Coming Soon )
The post Cryptotrading 101: Trendlines and Channels appeared first on Cryptoverze.